Industry
Industry
Aquaculture & Manufacturing
Aquaculture & Manufacturing
My Role
My Role
Product Designer
Product Designer
Timeline
Timeline
Sept – Nov
2025
Sept – Nov
2025
Platforms
Platforms
Web &
Mobile App
Web &
Mobile App


01 / Overview
01 / Overview
About the project
About the project
Running a fish feed business means managing inventory production customer orders farm operations and finances every day. As the business grows keeping everything organized becomes harder especially when teams rely on spreadsheets and disconnected tools.
Running a fish feed business means managing inventory production customer orders farm operations and finances every day. As the business grows keeping everything organized becomes harder especially when teams rely on spreadsheets and disconnected tools.
Aquaboost SaaS was designed to bring these operations together in one platform making day to day work simpler and helping business owners make faster decisions.
Aquaboost SaaS was designed to bring these operations together in one platform making day to day work simpler and helping business owners make faster decisions.
02 / Business Context
02 / Business Context
How fish feed businesses operate
How fish feed businesses operate
Every stage of the business depends on the one before it. If inventory is wrong production gets delayed. If production slows down sales are affected. Everything is connected.
Every stage of the business depends on the one before it. If inventory is wrong production gets delayed. If production slows down sales are affected. Everything is connected.
Procurement
Source raw materials
Step 1
Inventory
Track stock levels
Step 2
Production
Manufacture feed batches
Step 3
Procurement
Source raw materials
Step 1
Inventory
Track stock levels
Step 2
Production
Manufacture feed batches
Step 3
Sales
Process customer orders
Step 4
Farm Management
Monitor pond operations
Step 5
Analytics
Performance insights
Step 6
Sales
Process customer orders
Step 4
Farm Management
Monitor pond operations
Step 5
Analytics
Performance insights
Step 6
03 / The Problem
03 / The Problem
Manual processes cannot scale with a growing business
Manual processes cannot scale with a growing business
Most businesses were still managing everything manually. Information was spread across spreadsheets notebooks and different software making daily work slower and increasing mistakes.
Most businesses were still managing everything manually. Information was spread across spreadsheets notebooks and different software making daily work slower and increasing mistakes.
Inventory Tracking
Teams often struggled to know what was actually in stock leading to shortages or overstocking.
Production Management
Production schedules recipes and batches had to be tracked manually which slowed everything down.
Inventory Tracking
Teams often struggled to know what was actually in stock leading to shortages or overstocking.
Production Management
Production schedules recipes and batches had to be tracked manually which slowed everything down.
Fragmented Operations
Important information was spread across different tools making it difficult to stay organized.
Limited Visibility
Business owners couldn't quickly understand how the business was performing.
Fragmented Operations
Important information was spread across different tools making it difficult to stay organized.
Limited Visibility
Business owners couldn't quickly understand how the business was performing.
The guiding question
The guiding question
"What if every operation could be managed from one platform?"
"What if every operation could be managed from one platform?"
The core question that guided the product vision.
The core question that guided the product vision.
04 / Design Process
How I approached the project
I worked through the project in four stages starting with understanding the business and ending with developer handoff.
01
Discover
Stakeholder discussions
Business workflow analysis
Competitor research
Week 1 - 2
02
Define
Business goals
Feature prioritization
Information architecture
Week 2 - 3
03
Design
Wireframes
UI Design
Design System
Prototype
Week 3 - 5
04
Deliver
Founder feedback
Iteration
Developer handoff
Week 5 - 6
04 / Design Process
How I approached the project
I worked through the project in four stages starting with understanding the business and ending with developer handoff.
01
Discover
Stakeholder discussions
Business workflow analysis
Competitor research
Week 1 - 2
02
Define
Business goals
Feature prioritization
Information architecture
Week 2 - 3
03
Design
Wireframes
UI Design
Design System
Prototype
Week 3 - 5
04
Deliver
Founder feedback
Iteration
Developer handoff
Week 5 - 6
05 / RESEARCH
05 / RESEARCH
Research & Insights
Research & Insights
Through discussions with stakeholders and analysis of existing workflows, several recurring challenges became clear. Teams spent more time updating records and coordinating information than making business decisions. Most processes depended on manual tracking which increased the risk of errors and slowed down day to day operations.
Through discussions with stakeholders and analysis of existing workflows, several recurring challenges became clear. Teams spent more time updating records and coordinating information than making business decisions. Most processes depended on manual tracking which increased the risk of errors and slowed down day to day operations.
The research revealed four key needs:
The research revealed four key needs:
“I just want to see what's happening across the business without calling everyone.”
Operational Visibility
Teams wanted a clear overview of inventory, production and sales.
“We keep entering the same information again and again. There has to be an easier way.”
Process Automation
Manual processes consumed valuable time and increased the risk of human error.
“I just want to see what's happening across the business without calling everyone.”
Operational Visibility
Teams wanted a clear overview of inventory, production and sales.
“We keep entering the same information again and again. There has to be an easier way.”
Process Automation
Manual processes consumed valuable time and increased the risk of human error.
“Our data is scattered across excel files, whatsApp chats and notebooks :(”
Centralized Data
Business information was scattered across multiple tools making it difficult to access accurate data.
“By the time I get the numbers, the problem has already gotten bigger.”
Faster Decision Making
Managers needed real time insights to respond quickly to business changes.
“Our data is scattered across excel files, whatsapp chats and notebooks :(”
Centralized Data
Business information was scattered across multiple tools making it difficult to access accurate data.
“By the time I get the numbers, the problem has already gotten bigger.”
Faster Decision Making
Managers needed real time insights to respond quickly to business changes.
Key findings
Key findings
One source of truth is essential
Business data should live in one connected system
Simplicity drives adoption
Complex workflows need simple interfaces.
Visibility improves efficiency
Teams perform better when information is easy to access
Real time insights matter
Faster access to data leads to better operational decisions
One source of truth is essential
Business data should live in one connected system
Simplicity drives adoption
Complex workflows need simple interfaces.
Visibility improves efficiency
Teams perform better when information is easy to access
Real time insights matter
Faster access to data leads to better operational decisions
06 / Key Design Decisions
06 / Key Design Decisions
The choices that shaped the product
The choices that shaped the product
Each decision was driven by a real constraint discovered during research.
Each decision was driven by a real constraint discovered during research.
01
Navigation Simplification
ProBLEM
Too many navigation items made the product harder to use.
Decision
Grouped into 5 primary modules with a persistent sidebar.
Outcome
Reduced navigation time, smoother task switching between modules.
01
Navigation Simplification
ProBLEM
Too many navigation items made the product harder to use.
Decision
Grouped into 5 primary modules with a persistent sidebar.
Outcome
Reduced navigation time, smoother task switching between modules.
02
Dashboard Prioritization
ProBLEM
Users needed context before diving into specific modules.
Decision
Designed a KPI-first dashboard as the default landing screen.
Outcome
Business owners get instant operational snapshot on every login.
02
Dashboard Prioritization
ProBLEM
Users needed context before diving into specific modules.
Decision
Designed a KPI-first dashboard as the default landing screen.
Outcome
Business owners get instant operational snapshot on every login.
03
Production Tracking
ProBLEM
Batch management spread across multiple disconnected screens.
Decision
Unified production lifecycle into a single timeline card view.
Outcome
Complete batch visibility from materials to finished product.
03
Production
Tracking
ProBLEM
Batch management spread across multiple disconnected screens.
Decision
Unified production lifecycle into a single timeline card view.
Outcome
Complete batch visibility from materials to finished product.
07 / THE SOLUTION
07 / THE SOLUTION
Product Overview
Product Overview
Every module follows the same layout and interaction patterns making the product easier to learn and use.
Every module follows the same layout and interaction patterns making the product easier to learn and use.
DASHBOARD
Monitoring Operations in Real Time
Designed a centralized dashboard that brings together production, inventory, farm activities, weather alerts and key business metrics into a single view.
Dashboard Overview
Live Metrics
Farm Monitoring
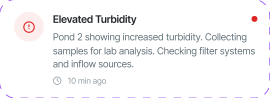
Weather Alerts
Inventory Status
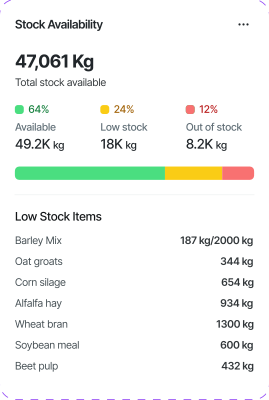
Low stock alerts


Inventory
Real-time stock visibility across all materials
A centralized inventory system tracks raw materials, stock levels, and movements in real time. Teams can set reorder thresholds and get alerts before shortages impact production.
Stock level tracking
Low stock alerts
Supplier management
Movement history
Production
End-to-end feed batch management
Production workflows allow teams to manage feed recipes, monitor batches, and track manufacturing progress from start to finish. Managers can spot bottlenecks and maintain consistency.
Recipe management
Batch tracking
Production scheduling
Quality control checkpoints


Farm Management
Monitor every pond, every cycle
A dedicated module for managing ponds, tracking fish health, and monitoring farm performance. Teams get the operational insights needed to make better farming decisions.
Pond management
Feed schedule tracking
Growth monitoring
Harvest planning
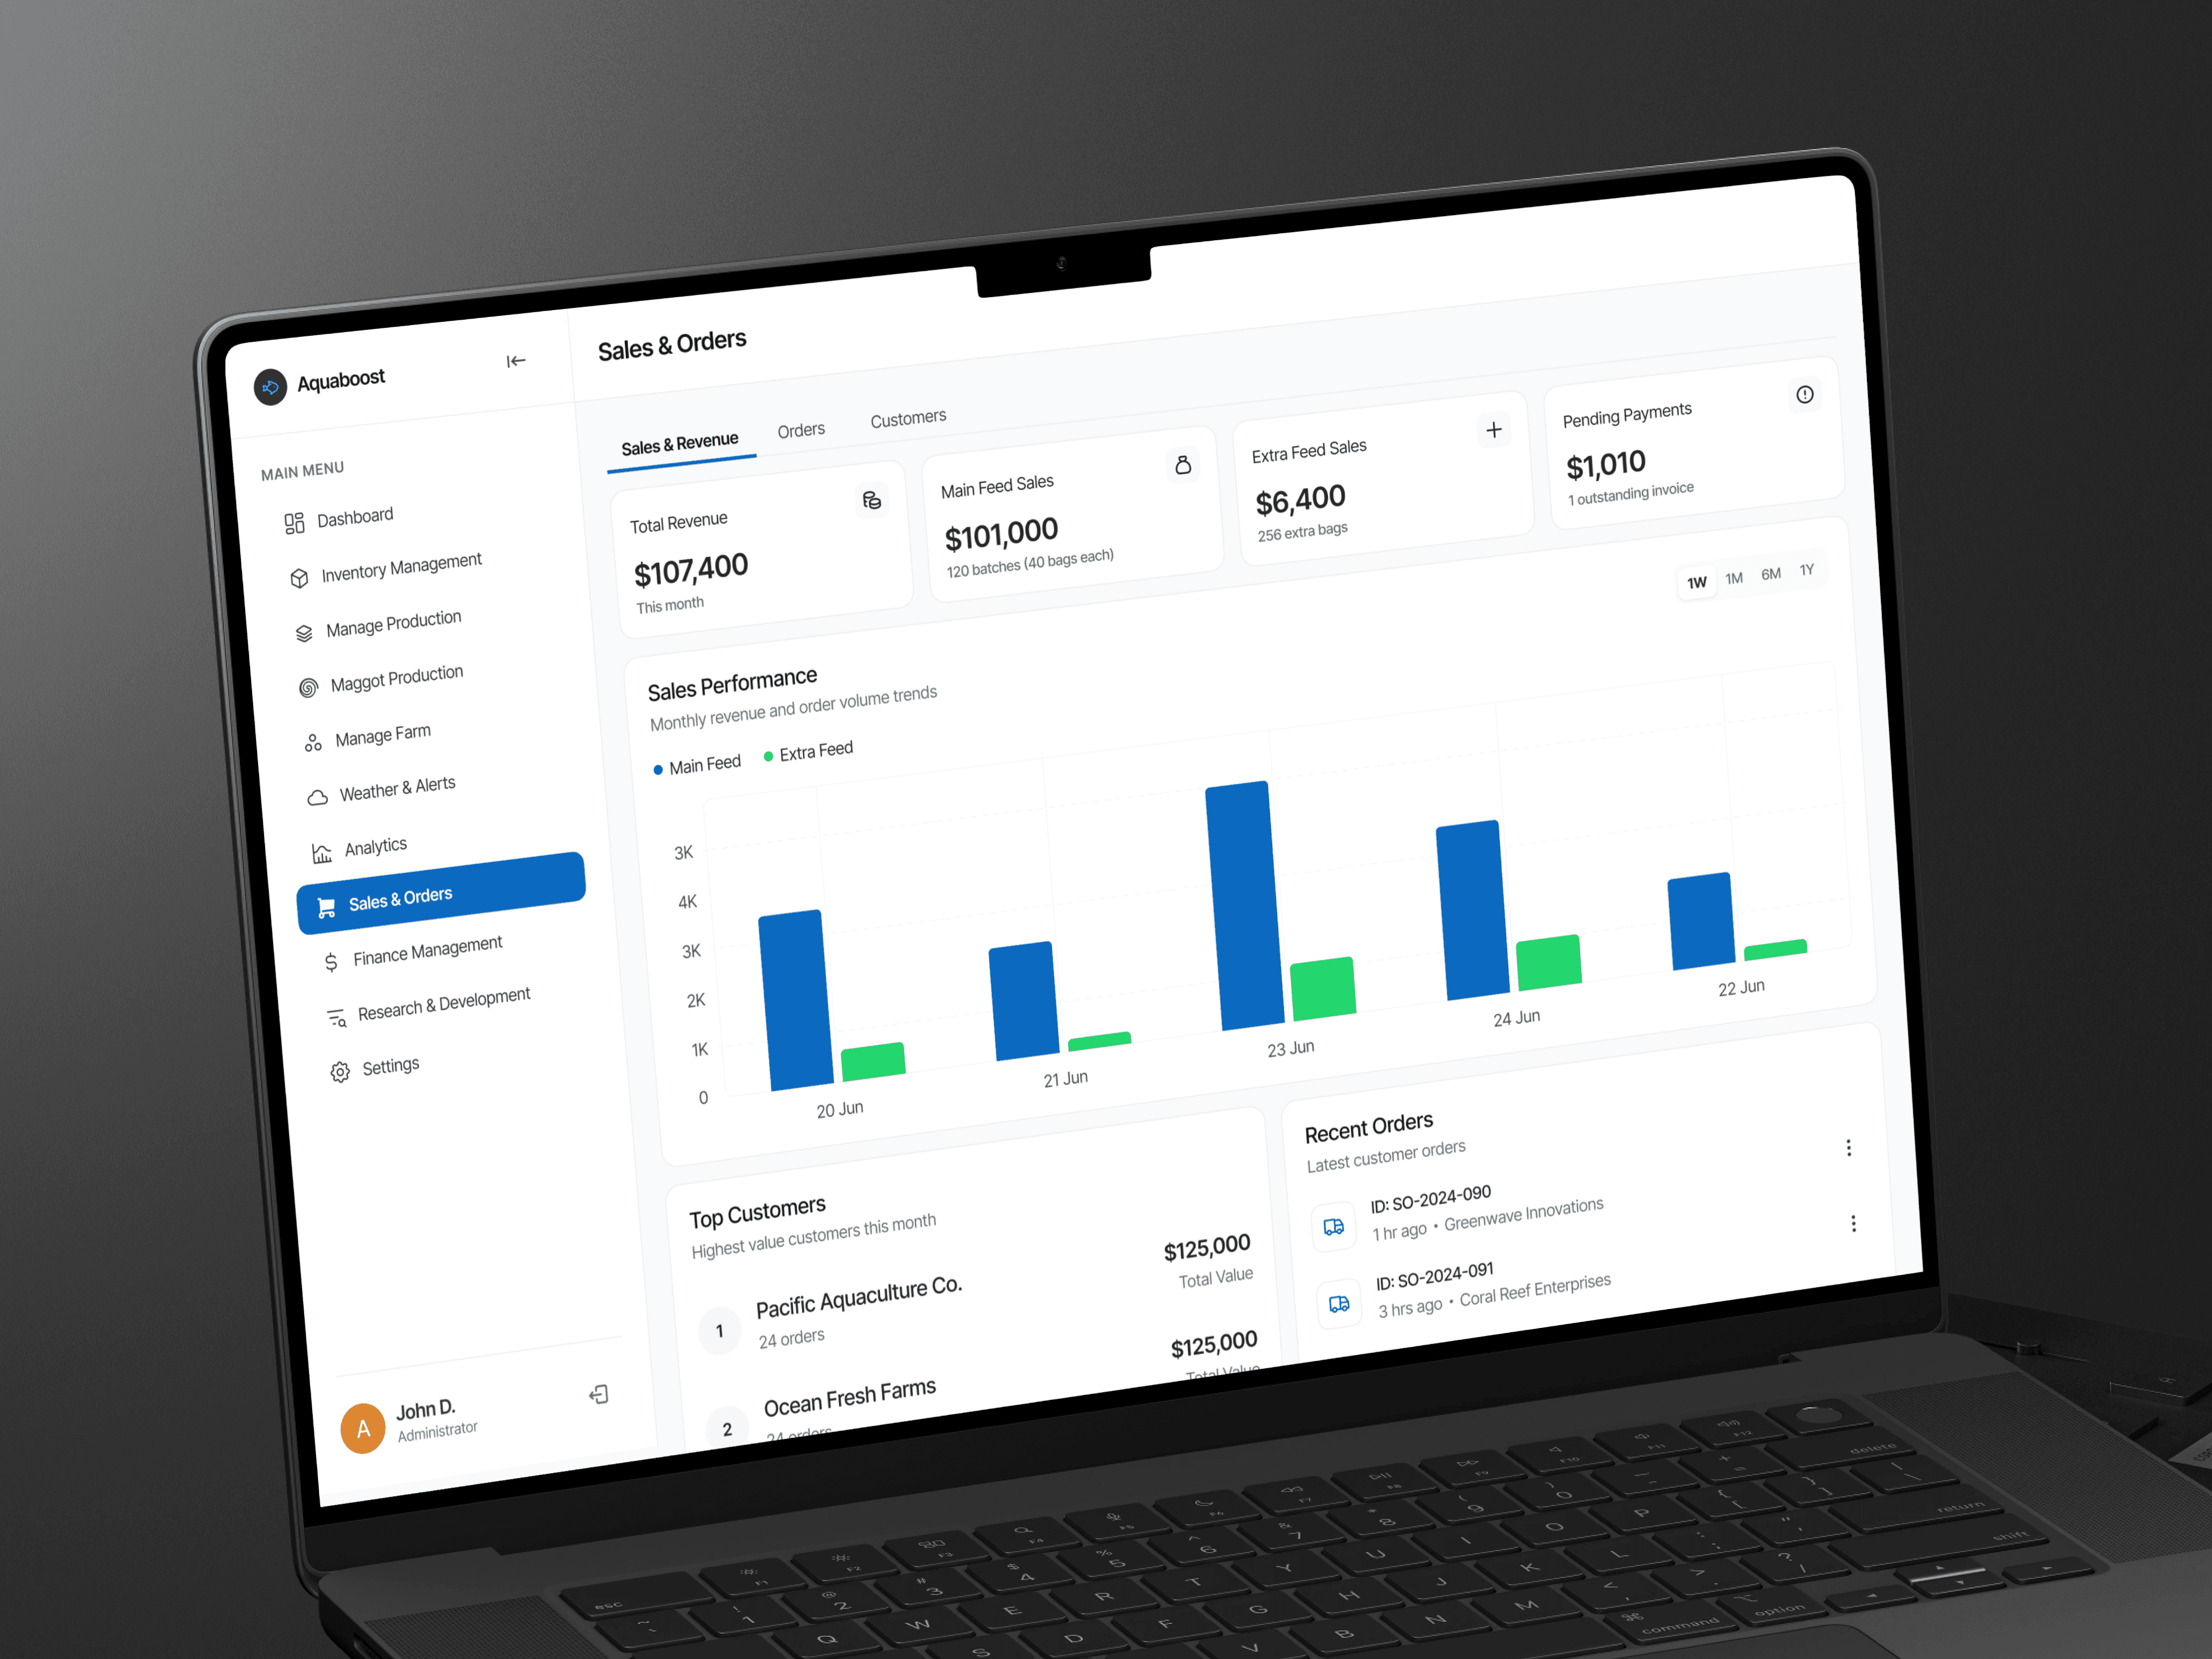
Sales & CRM
From order to delivery in one view
A streamlined system for managing customer orders, sales activities, and business relationships. Every transaction and interaction is visible across the full pipeline.
Customer profiles
Order management
Payment tracking
Delivery status

Finance
Integrated financial visibility
Financial data flows automatically from sales and inventory into a unified finance view. No more reconciling records between separate systems.
Revenue tracking
Expense management
Invoice generation
Profit margin analysis
Analytics
Business intelligence built in
A unified analytics dashboard that brings together operational metrics from across the platform. Business owners can monitor performance and identify trends without switching tools.
Sales analytics
Production KPIs
Inventory trends
Farm performance reports

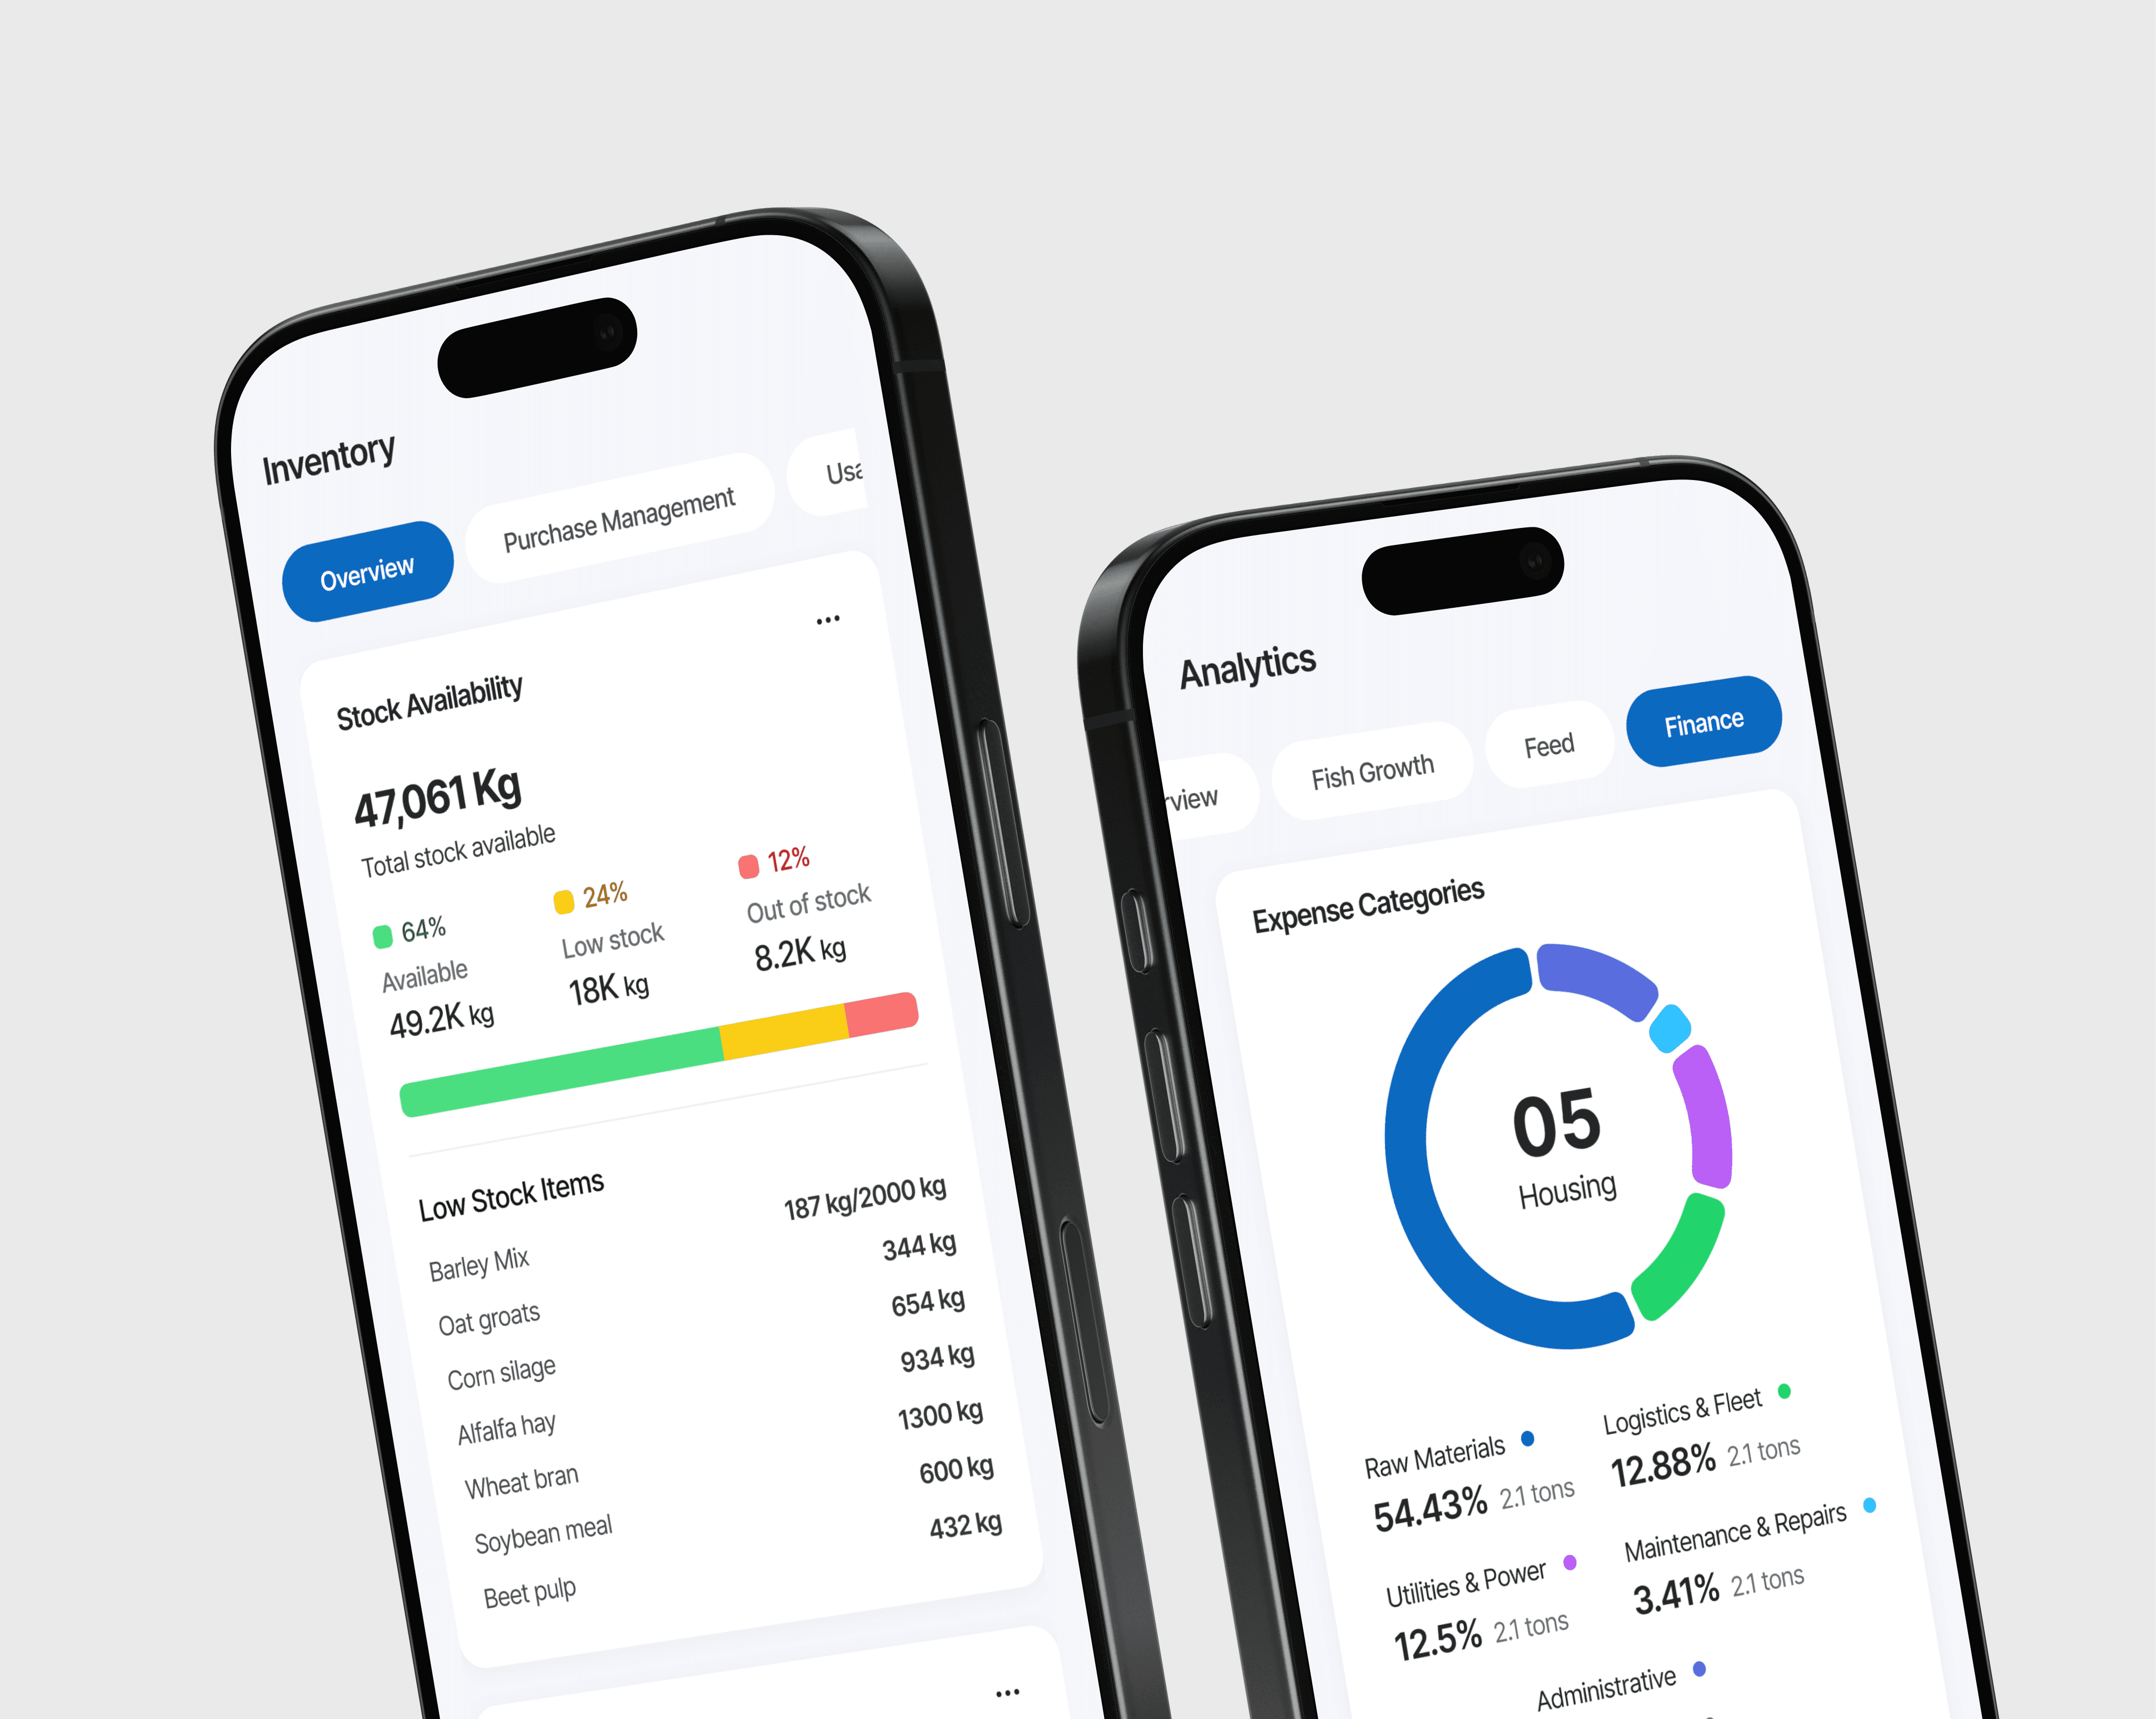
Mobile Experience
Designed for the field, not just the office
The mobile app lets farmers place orders of fish feed bags, track deliveries and monitor their farm analytics on the go, without needing a desktop.
The mobile app lets farmers place orders of fish feed bags, track deliveries and monitor their farm analytics on the go, without needing a desktop.
Place Order
Place Order
Track Orders
Track Orders
Farm Analytics
Farm Analytics
Account & settings
Account & settings


08 / DESIGN SYSTEM
08 / DESIGN SYSTEM
Visual Style & Components
Visual Style & Components
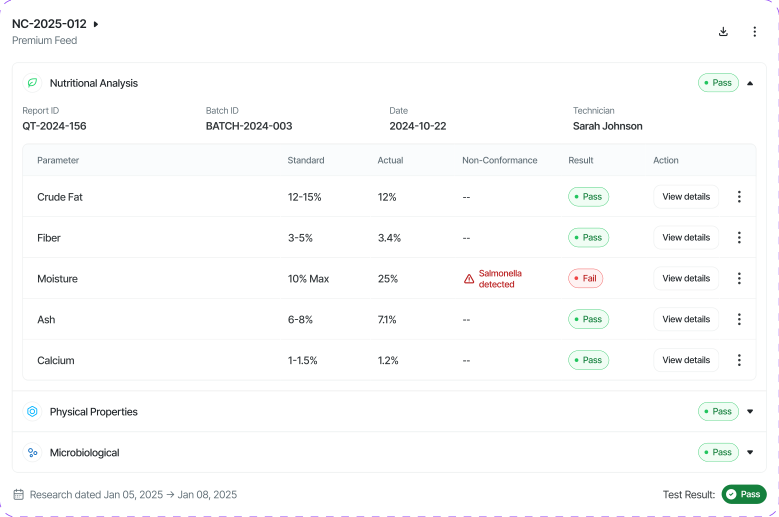
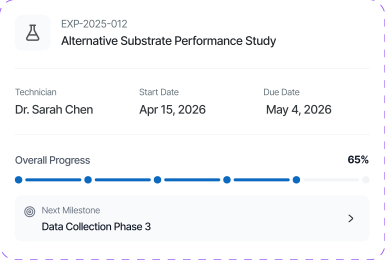
I created a consistent design system so every screen feels connected and easy to use.
I created a consistent design system so every screen feels connected and easy to use.
TYPOGRAPHY
Aa
40
/
SEMIBOLD
Aa
24
/
SEMIBOLD
Aa
16
/
SEMIBOLD
Aa
14
/
SEMIBOLD
COLORS
#0B69C0
#00B2FF
#14191C
#EFF2F4
BUTTONS
Button
Button
Button
Button
Button
Button
Dashboard
Newest
TYPOGRAPHY
Aa
40
/
SEMIBOLD
Aa
24
/
SEMIBOLD
Aa
16
/
SEMIBOLD
Aa
14
/
SEMIBOLD
COLORS
#0B69C0
#00B2FF
#14191C
#EFF2F4
BUTTONS
Button
Button
Button
Button
Button
Button
Dashboard
Newest
COMPONENTS






COMPONENTS
09 / DELIVERABLES
09 / DELIVERABLES
Developer Handoff & Launch Support
Developer Handoff & Launch Support
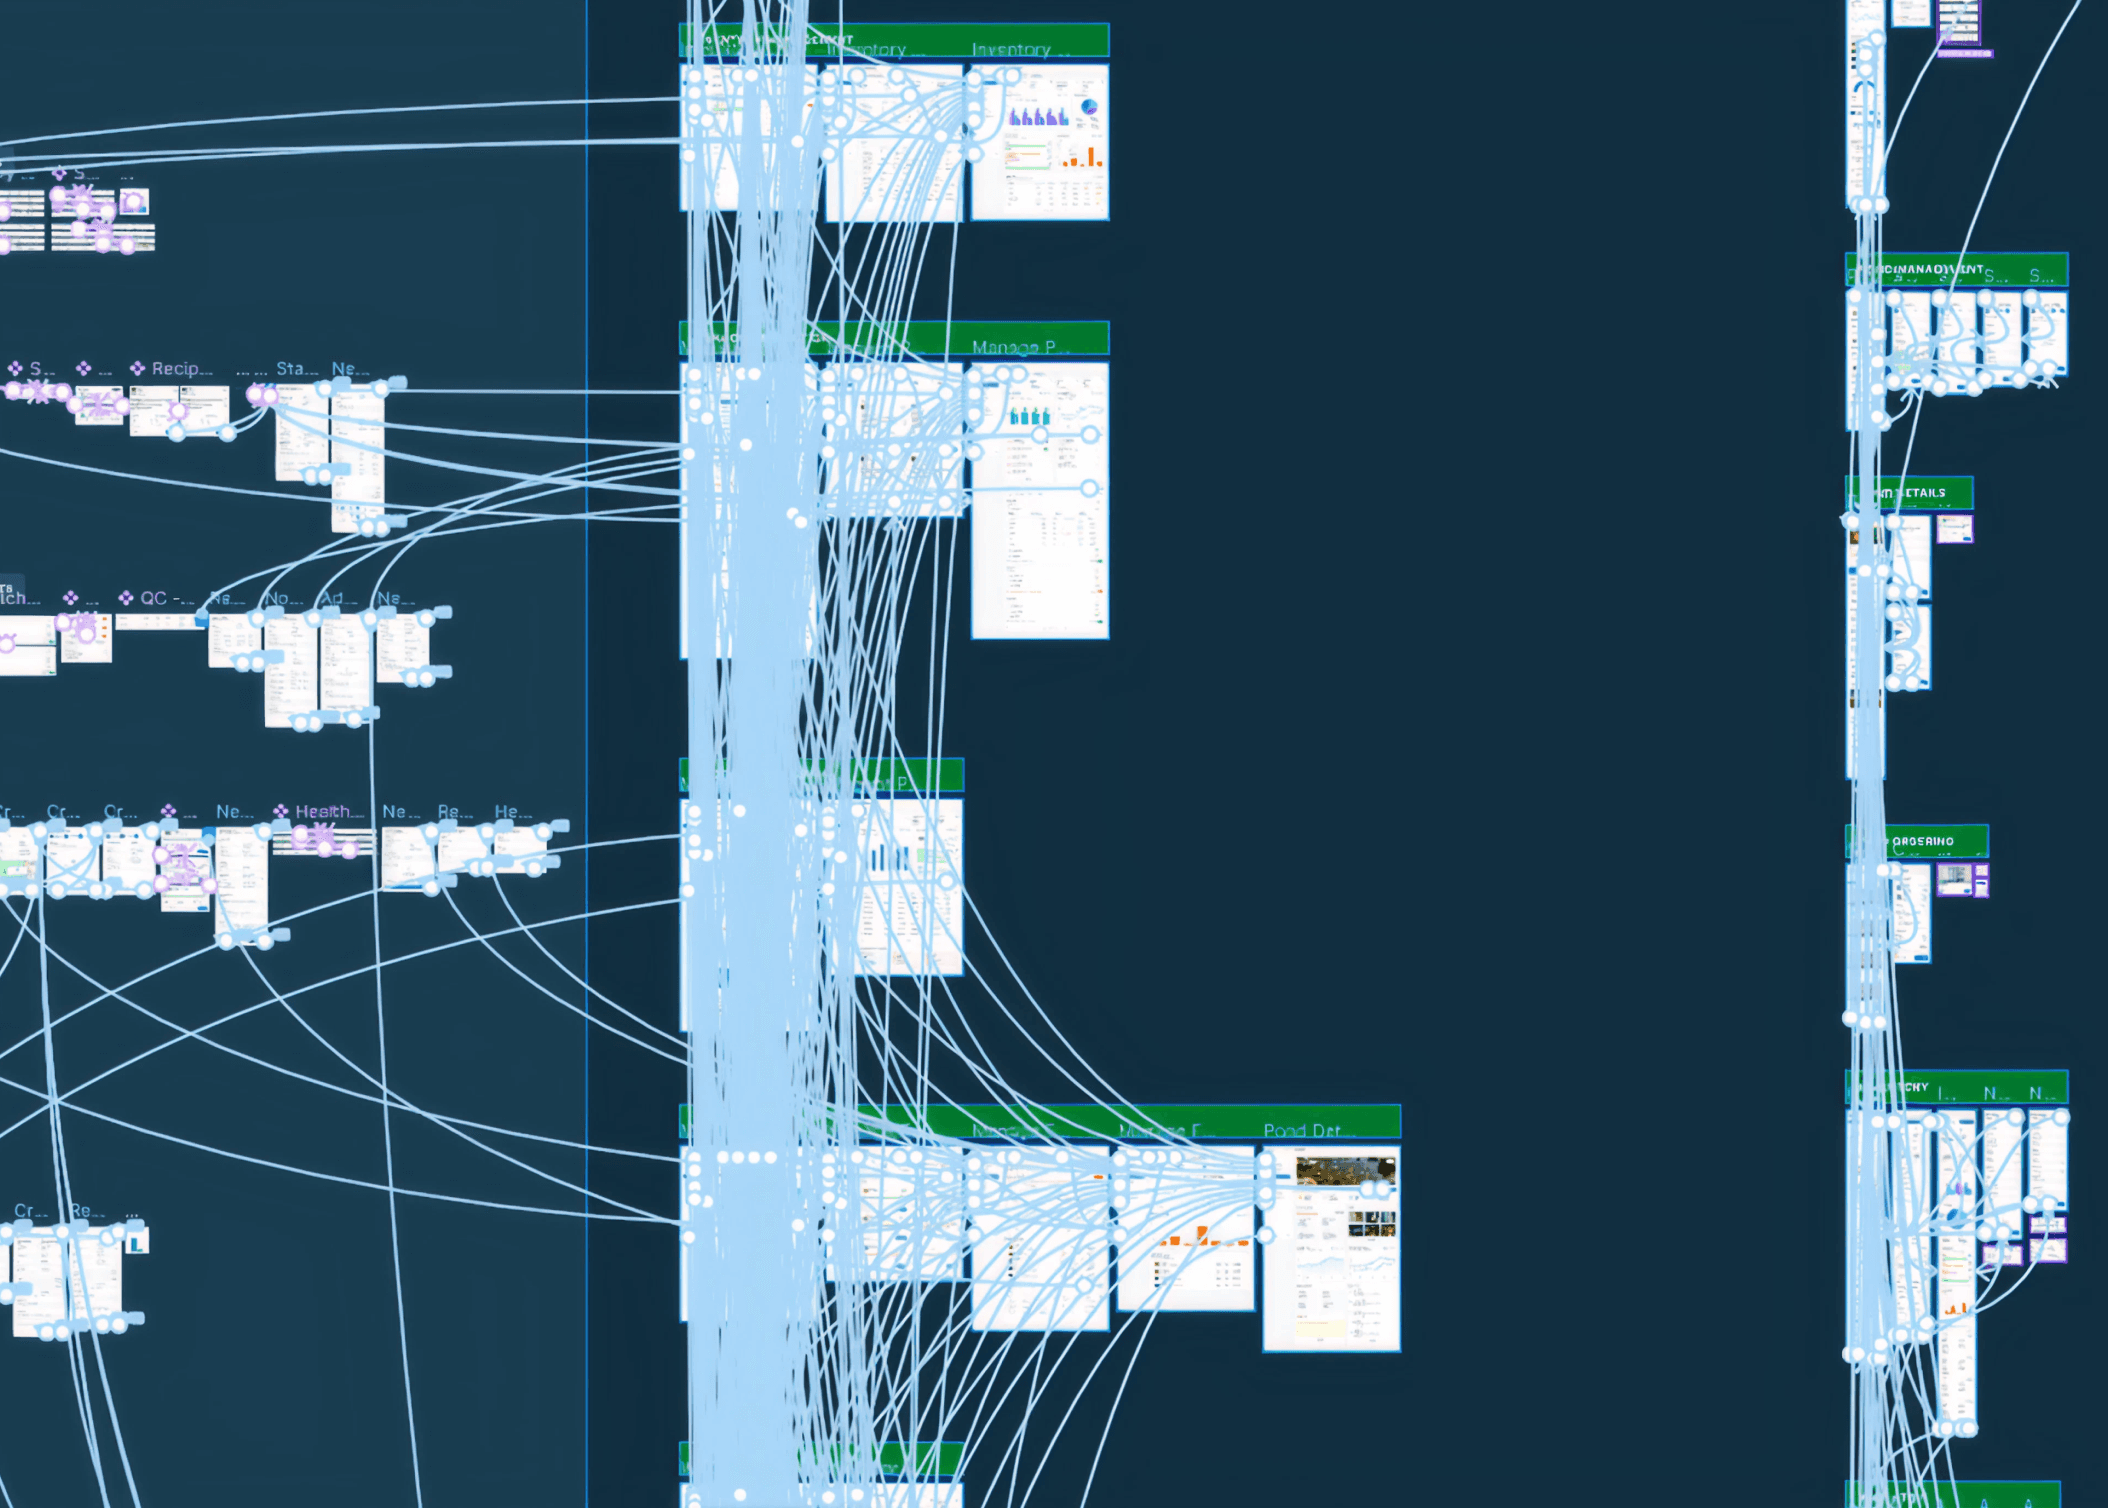
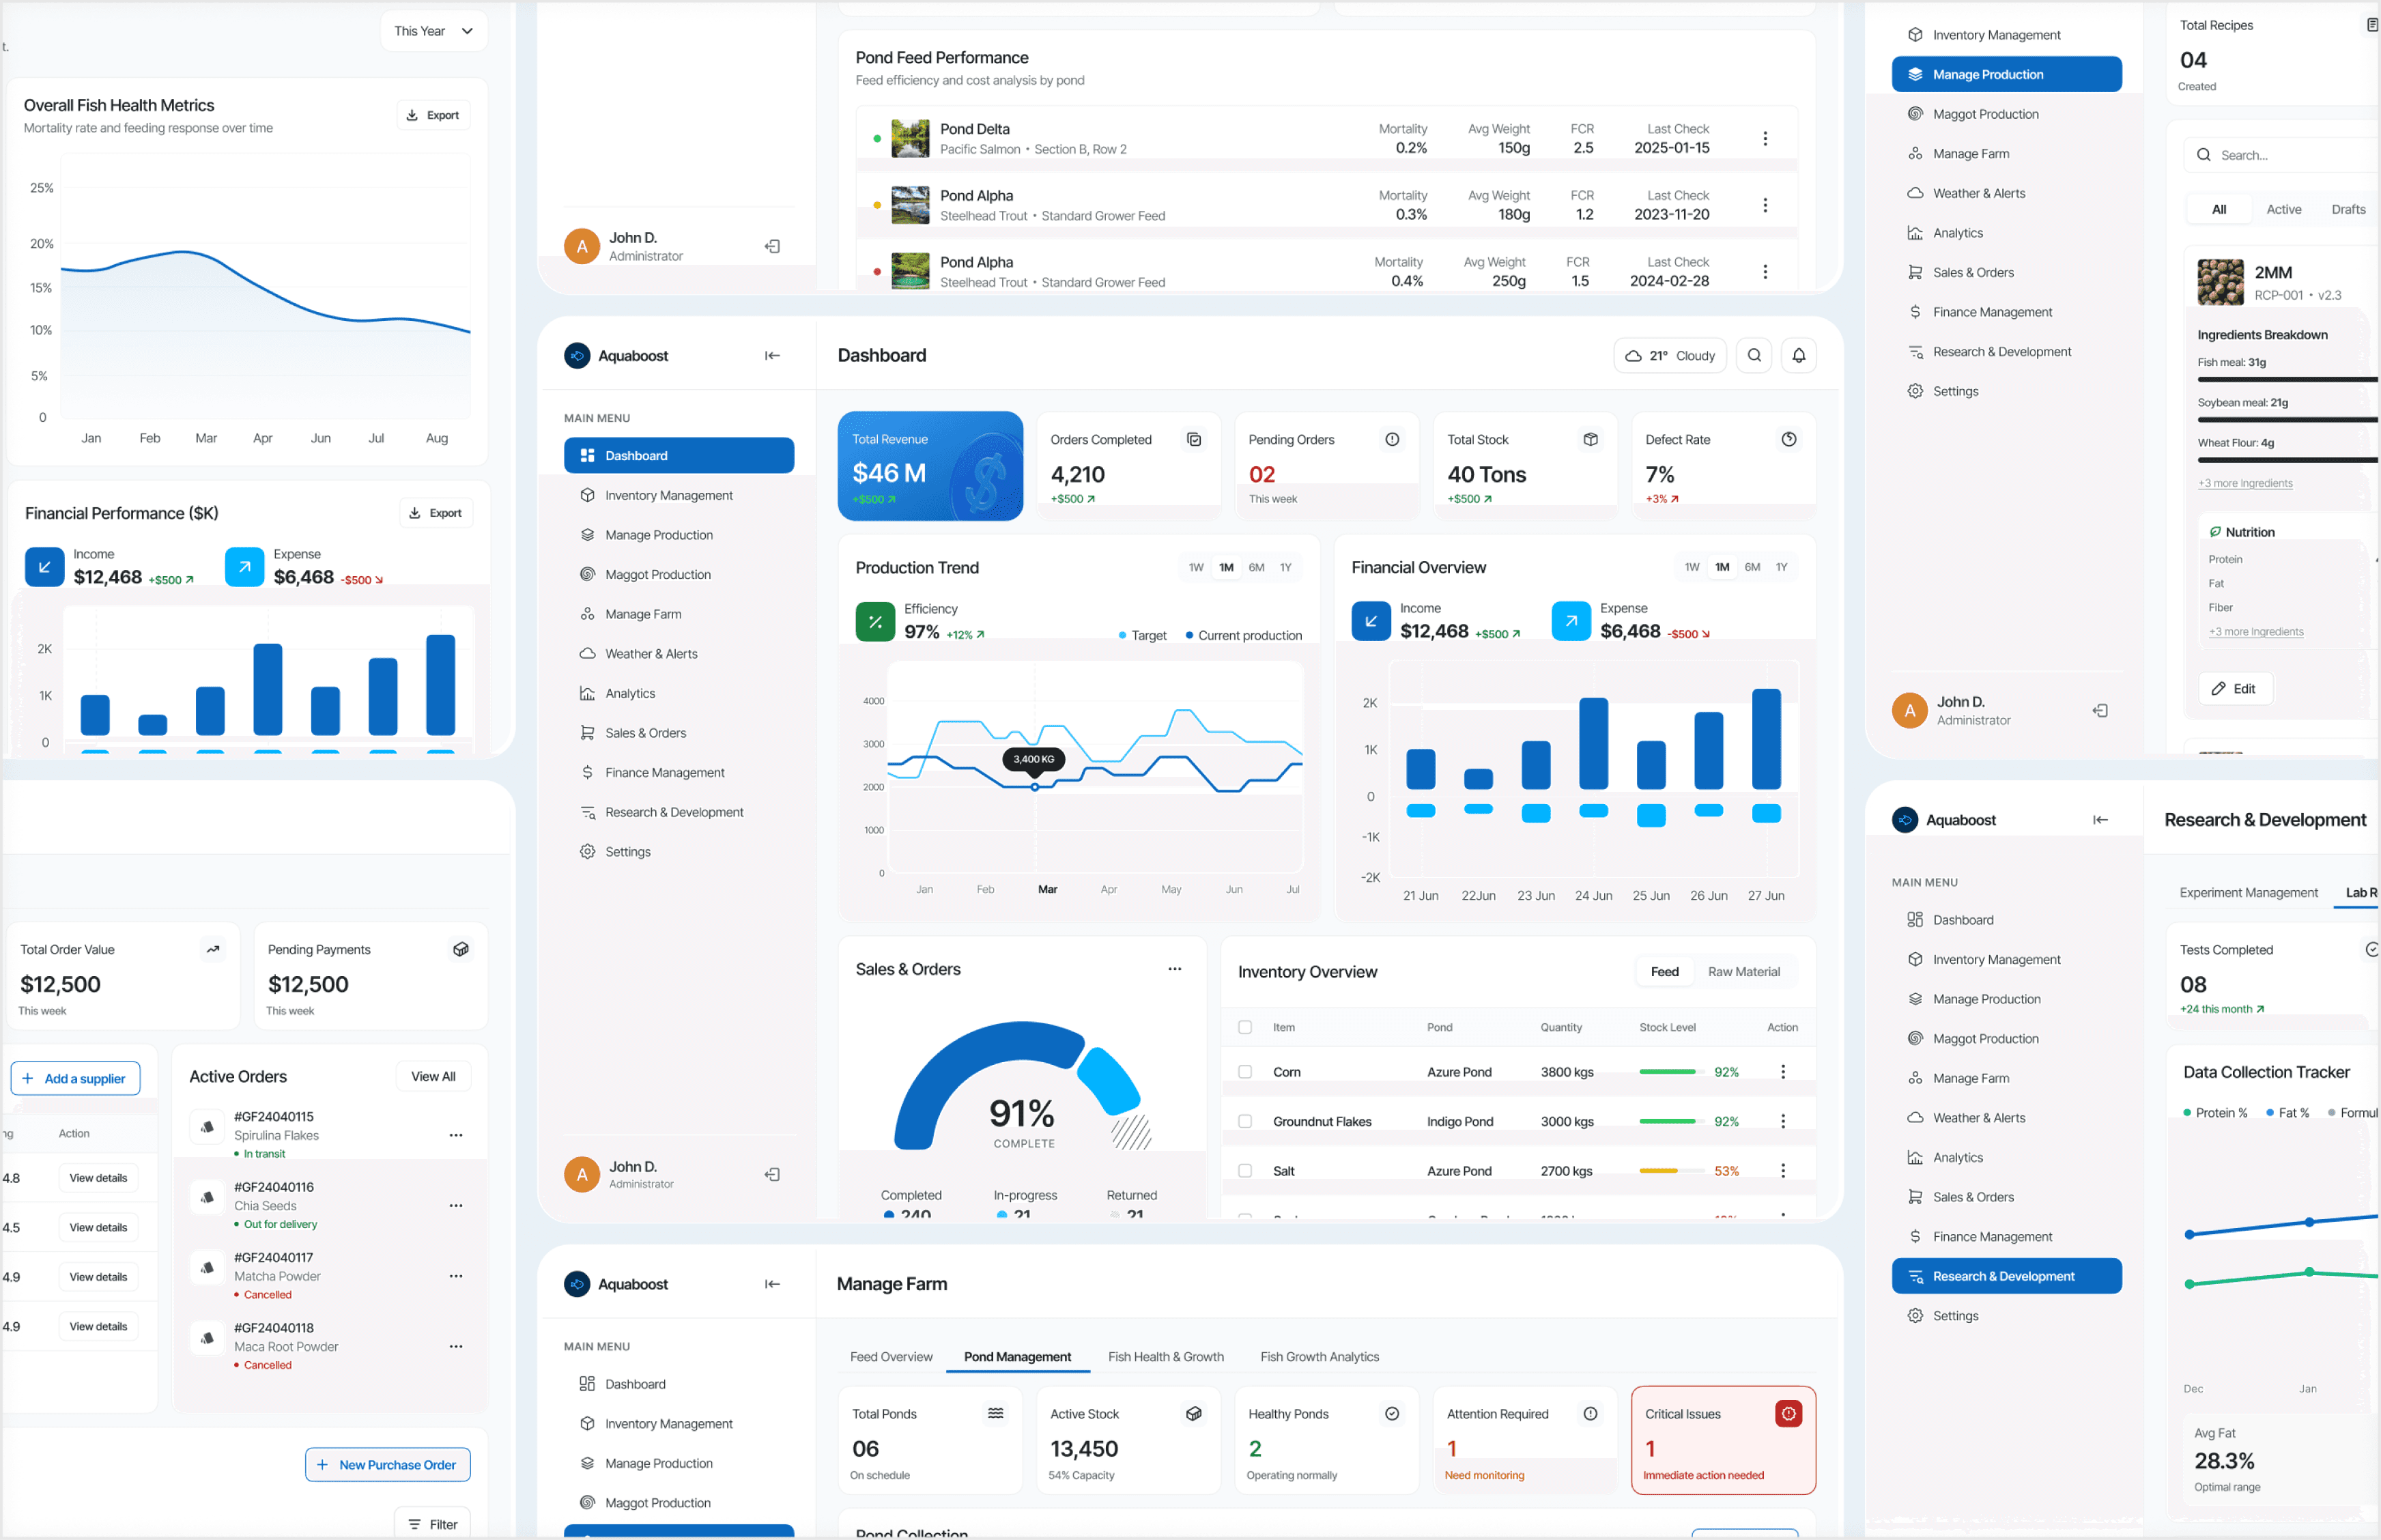
Everything delivered during the project from wireframes to the final design system.
Everything delivered during the project from wireframes to the final design system.
Organized design files

Prototype Flows
Organized design files
Prototype Flows

Web App Screens
Web App Screens
Mobile App Screens

Mobile App Screens
10 / Learnings
10 / Learnings
What I would carry into the next project
What I would carry into the next project
01
Understand the operation before the interface
The strongest design decisions came from mapping how the business physically works, not from looking at other dashboards.
02
Complexity should live in the system, not the screen
Users accepted dense data when the hierarchy was clear. What they rejected was having to hold logic in their heads.
03
Consistency is a feature
A strict, small component library let seven modules ship quickly and still feel like one considered product.
01
Understand the operation before the interface
The strongest design decisions came from mapping how the business physically works, not from looking at other dashboards.
02
Complexity should live in the system, not the screen
Users accepted dense data when the hierarchy was clear. What they rejected was having to hold logic in their heads.
03
Consistency is a
feature
A strict, small component library let seven modules ship quickly and still feel like one considered product.
Next Project
Simplify Invoice - Invoicing and Financial Management Platform Built for Small Businesses
Coming Soon

Next Project
Simplify Invoice - Invoicing and Financial Management Platform Built for Small Businesses
Coming Soon
THANKS
THANKS
DASHBOARD
Monitoring Operations in Real Time
Designed a centralized dashboard that brings together production, inventory, farm activities, weather alerts and key business metrics into a single view.
Dashboard Overview
Farm Monitoring
Inventory Status
Low stock alerts
Weather Alerts
Live Metrics
Inventory
Real-time stock visibility across all materials
A centralized inventory system tracks raw materials, stock levels, and movements in real time. Teams can set reorder thresholds and get alerts before shortages impact production.
Stock level tracking
Low stock alerts
Supplier management
Movement history
Production
End-to-end feed batch management
Production workflows allow teams to manage feed recipes, monitor batches, and track manufacturing progress from start to finish. Managers can spot bottlenecks and maintain consistency.
Recipe management
Batch tracking
Production
scheduling
Quality control checkpoints
Production
Monitor every pond, every cycle
A dedicated module for managing ponds, tracking fish health, and monitoring farm performance. Teams get the operational insights needed to make better farming decisions.
Pond management
Feed schedule tracking
Growth monitoring
Harvest planning
Sales & CRM
From order to delivery in one view
A streamlined system for managing customer orders, sales activities, and business relationships. Every transaction and interaction is visible across the full pipeline.
Customer profiles
Order management
Payment tracking
Delivery status
Finance
Integrated financial visibility
Financial data flows automatically from sales and inventory into a unified finance view. No more reconciling records between separate systems.
Revenue tracking
Expense management
Invoice generation
Profit margin analysis
Analytics
Business intelligence built in
A unified analytics dashboard that brings together operational metrics from across the platform. Business owners can monitor performance and identify trends without switching tools.
Sales analytics
Production KPIs
Inventory trends
Profit margin analysis
Aquaboost - All in One Management Platform for Fish Feed Manufacturing and Farm Operations
Aquaboost -
All in One Management Platform for Fish Feed Manufacturing and Farm Operations
Back

Industry
Aquaculture & Manufacturing
My Role
Product Designer
Product
Designer
Timeline
Sept – Nov
2025
Platforms
Web &
Mobile App


01 / Overview
01 / Overview
About the project
About the project
Running a fish feed business means managing inventory production customer orders farm operations and finances every day. As the business grows keeping everything organized becomes harder especially when teams rely on spreadsheets and disconnected tools.
Running a fish feed business means managing inventory production customer orders farm operations and finances every day. As the business grows keeping everything organized becomes harder especially when teams rely on spreadsheets and disconnected tools.
Aquaboost SaaS was designed to bring these operations together in one platform making day to day work simpler and helping business owners make faster decisions.
Aquaboost SaaS was designed to bring these operations together in one platform making day to day work simpler and helping business owners make faster decisions.
02 / Business Context
02 / Business Context
How fish feed businesses operate
How fish feed businesses operate
Every stage of the business depends on the one before it. If inventory is wrong production gets delayed. If production slows down sales are affected. Everything is connected.
Every stage of the business depends on the one before it. If inventory is wrong production gets delayed. If production slows down sales are affected. Everything is connected.
Procurement
Source raw materials
Step 1
Inventory
Track stock levels
Step 2
Production
Manufacture feed batches
Step 3
Sales
Process customer orders
Step 4
Farm Management
Monitor pond operations
Step 5
Analytics
Performance insights
Step 6
03 / The Problem
03 / The Problem
Manual processes cannot scale with a growing business
Manual processes cannot scale with a growing business
Most businesses were still managing everything manually. Information was spread across spreadsheets notebooks and different software making daily work slower and increasing mistakes.
Most businesses were still managing everything manually. Information was spread across spreadsheets notebooks and different software making daily work slower and increasing mistakes.
Inventory Tracking
Teams often struggled to know what was actually in stock leading to shortages or overstocking.
Production Management
Production schedules recipes and batches had to be tracked manually which slowed everything down.
Fragmented Operations
Important information was spread across different tools making it difficult to stay organized.
Limited Visibility
Business owners couldn't quickly understand how the business was performing.
The guiding question
The guiding question
"What if every operation could be managed from one platform?"
"What if every operation could be managed from one platform?"
The core question that guided the product vision.
The core question that guided the product vision.
04 / Design Process
04 / Design Process
How I approached the project
How I approached the project
I worked through the project in four stages starting with understanding the business and ending with developer handoff.
I worked through the project in four stages starting with understanding the business and ending with developer handoff.
01
Discover
Stakeholder discussions
Business workflow analysis
Competitor research
Week 1 - 2
02
Define
Business goals
Feature prioritization
Information architecture
Week 2 - 3
03
Design
Wireframes
UI Design
Design System
Prototype
Week 3 - 5
04
Deliver
Founder feedback
Iteration
Developer handoff
Week 5 - 6
05 / RESEARCH
05 / RESEARCH
Research & Insights
Research & Insights
Through discussions with stakeholders and analysis of existing workflows, several recurring challenges became clear. Teams spent more time updating records and coordinating information than making business decisions. Most processes depended on manual tracking which increased the risk of errors and slowed down day to day operations.
Through discussions with stakeholders and analysis of existing workflows, several recurring challenges became clear. Teams spent more time updating records and coordinating information than making business decisions. Most processes depended on manual tracking which increased the risk of errors and slowed down day to day operations.
The research revealed four key needs:
“I just want to see what's happening across the business without calling everyone.”
Operational Visibility
Teams wanted a clear overview of inventory, production and sales.
Teams wanted a clear overview of inventory, production and sales.
“We keep entering the same information again and again. There has to be an easier way.”
Process Automation
Manual processes consumed valuable time and increased the risk of human error.
Manual processes consumed valuable time and increased the risk of human error.
“Our data is scattered across excel files, whatsapp chats and notebooks :(”
Centralized Data
Business information was scattered across multiple tools making it difficult to access accurate data.
Business information was scattered across multiple tools making it difficult to access accurate data.
“By the time I get the numbers, the problem has already gotten bigger.”
“By the time I get the numbers, the problem has already gotten bigger.”
Faster Decision Making
Managers needed real time insights to respond quickly to business changes.
Managers needed real time insights to respond quickly to business changes.
Key findings
One source of truth is essential
Business data should live in one connected system
Simplicity drives adoption
Complex workflows need simple interfaces.
Visibility improves efficiency
Teams perform better when information is easy to access
Real time insights matter
Faster access to data leads to better operational decisions
06 / Key Design Decisions
06 / Key Design Decisions
The choices that shaped the product
The choices that shaped the product
Each decision was driven by a real constraint discovered during research.
Each decision was driven by a real constraint discovered during research.
01
Navigation Simplification
Navigation Simplification
ProBLEM
ProBLEM
Too many navigation items made the product harder to use.
Too many navigation items made the product harder to use.
Decision
Decision
Grouped into 5 primary modules with a persistent sidebar.
Grouped into 5 primary modules with a persistent sidebar.
Outcome
Outcome
Reduced navigation time, smoother task switching between modules.
Reduced navigation time, smoother task switching between modules.
02
Dashboard Prioritization
Dashboard Prioritization
ProBLEM
ProBLEM
Users needed context before diving into specific modules.
Users needed context before diving into specific modules.
Decision
Decision
Designed a KPI-first dashboard as the default landing screen.
Designed a KPI-first dashboard as the default landing screen.
Outcome
Outcome
Business owners get instant operational snapshot on every login.
Business owners get instant operational snapshot on every login.
03
Production
Tracking
Production Tracking
ProBLEM
ProBLEM
Batch management spread across multiple disconnected screens.
Batch management spread across multiple disconnected screens.
Decision
Decision
Unified production lifecycle into a single timeline card view.
Unified production lifecycle into a single timeline card view.
Outcome
Outcome
Complete batch visibility from materials to finished product.
Complete batch visibility from materials to finished product.
07 / THE SOLUTION
07 / THE SOLUTION
Product Overview
Product Overview
Every module follows the same layout and interaction patterns making the product easier to learn and use.
Every module follows the same layout and interaction patterns making the product easier to learn and use.
Mobile Experience
Designed for the field, not just the office
Designed for the field, not just the office
The mobile app lets farmers place orders of fish feed bags, track deliveries and monitor their farm analytics on the go, without needing a desktop.
Place Order
Track Orders
Farm Analytics
Account & settings
08 / DESIGN SYSTEM
Visual Style & Components
Visual Style & Components
I created a consistent design system so every screen feels connected and easy to use.
TYPOGRAPHY
Aa
40
/
SEMIBOLD
Aa
24
/
SEMIBOLD
Aa
16
/
SEMIBOLD
Aa
14
/
SEMIBOLD
COLORS
#0B69C0
#00B2FF
#14191C
#EFF2F4
BUTTONS
Button
Button
Button
Button
Button
Button
Dashboard
Newest
COMPONENTS
09 / DELIVERABLES
09 / DELIVERABLES
Developer Handoff & Launch Support
Developer Handoff & Launch Support
Everything delivered during the project from wireframes to the final design system.
Organized design files
Prototype Flows
Web App Screens
Mobile App Screens
10 / Learnings
10 / Learnings
What I would carry into the next project
What I would carry into the next project
01
Understand the operation before the interface
The strongest design decisions came from mapping how the business physically works, not from looking at other dashboards.
02
Complexity should live in the system, not the screen
Users accepted dense data when the hierarchy was clear. What they rejected was having to hold logic in their heads.
03
Consistency is a
feature
A strict, small component library let seven modules ship quickly and still feel like one considered product.
Next Project
Simplify Invoice - Invoicing and Financial Management Platform Built for Small Businesses
Coming Soon
Next Project
Simplify Invoice - Invoicing and Financial Management Platform Built for Small Businesses
Coming Soon
THANKS
THANKS
DASHBOARD
Monitoring Operations in Real Time
Monitoring Operations in Real Time
Designed a centralized dashboard that brings together production, inventory, farm activities, weather alerts and key business metrics into a single view.
Dashboard Overview
Farm Monitoring
Inventory Status
Low stock alerts
Weather Alerts
Live Metrics
Inventory
Real-time stock visibility across all materials
Real-time stock visibility across all materials
A centralized inventory system tracks raw materials, stock levels, and movements in real time. Teams can set reorder thresholds and get alerts before shortages impact production.
Stock level tracking
Low stock alerts
Supplier management
Movement history
Production
End-to-end feed batch management
End-to-end feed batch management
Production workflows allow teams to manage feed recipes, monitor batches, and track manufacturing progress from start to finish. Managers can spot bottlenecks and maintain consistency.
Recipe management
Batch tracking
Production
scheduling
Quality control checkpoints
Production
Monitor every pond, every cycle
Monitor every pond, every cycle
A dedicated module for managing ponds, tracking fish health, and monitoring farm performance. Teams get the operational insights needed to make better farming decisions.
Pond management
Feed schedule tracking
Growth monitoring
Harvest planning
Sales & CRM
From order to delivery in one view
From order to delivery in one view
A streamlined system for managing customer orders, sales activities, and business relationships. Every transaction and interaction is visible across the full pipeline.
Customer profiles
Order management
Payment tracking
Delivery status
Finance
Integrated financial visibility
Integrated financial visibility
Financial data flows automatically from sales and inventory into a unified finance view. No more reconciling records between separate systems.
Revenue tracking
Expense management
Invoice generation
Profit margin analysis
Analytics
Business intelligence built in
Business intelligence built in
A unified analytics dashboard that brings together operational metrics from across the platform. Business owners can monitor performance and identify trends without switching tools.
Sales analytics
Production KPIs
Inventory trends
Profit margin analysis